
Generation Z and Inflation
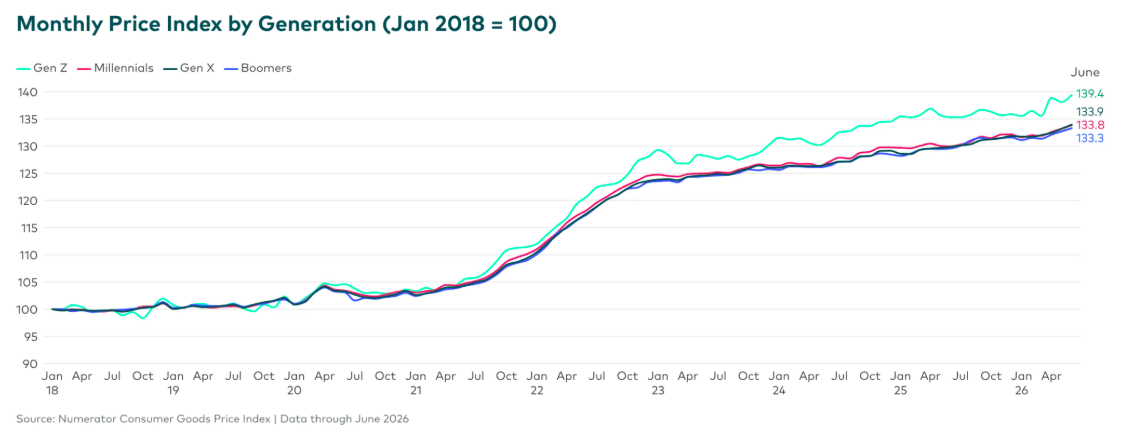
Generation Z, born between 1997 and 2012, is experiencing elevated levels of inflation compared to other generations. According to Numerator’s June 2026 Consumer Goods Price Index, the prices for the goods Gen Z tends to purchase have surged by 39.4% since January 2018. This increase is significantly higher than the national average of 33.8%.
Consumption Patterns and Inflation Impact
Paul Stanley, Numerator’s senior economist, discussed the data with Newsweek. He pointed out that quick-service restaurant inflation significantly drives the higher rates of inflation Gen Z faces. Both Gen Z and low-income consumers spend disproportionately more on quick-service restaurants, where prices have risen by 54% compared to a market average of 33.8%.
Financial Strain on Gen Z
Economics professor Hakan Yilmazkuday from Florida International University emphasized that the financial burden on Gen Z is accurately depicted through verified household transactions rather than survey-modeled data. These consumers report financial stress affecting their relationships as affordability becomes a growing concern.
Dining and Spending Habits
Data from the restaurant management app Menumiz shows that Gen Z, aged 14 to 29, tends to eat out more frequently than other age groups. Approximately 71% of surveyed Gen Z consumers plan to increase their dining frequency through 2026, spending about $51 per dine-in meal and $36 per takeout order.
The National Restaurant Association indicates monthly menu prices continue to rise by around 0.2%, contributing further to Gen Z’s inflation exposure. Aside from dining habits, their purchases of groceries, household goods, and health products also contribute to higher inflation rates.
Adaptation to Rising Prices
Generally, consumers adapt to rising costs by changing brands, sizes, or shopping locations. However, the data suggests younger consumers might not be adjusting as much as older generations, enduring higher costs for everyday items.
Overall Price Increases
Numerator’s Consumer Goods Price Index reported that prices for everyday purchases have risen over the past three months. June saw a 0.70% increase following May and April increases of 0.51% and 0.44%. Household goods prices are up 3.4% compared to last year.
Numerator’s Data Collection Methodology
Numerator gathers its data from 200,000 U.S. households via the Receipt Hog mobile app, representing 20% of household spending. Excluded are major expenditure categories like housing, cars, and healthcare. The company uses the Fisher Price Index for measuring inflation, aligning closely with official inflation indicators such as the PCE Food & Beverage measure.